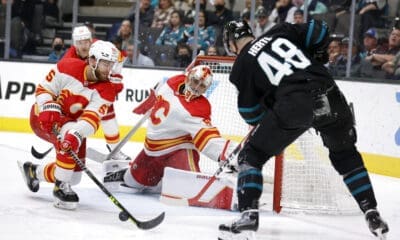
Calgary Flames
Quality over Quantity- Flames vs. Blues Stat Recap
Well they did have more shots. Did they matter? Probably not.
Here is a ranking of offensive stats that, when you generate enough of them, will win you hockey games
If you want to score, you have to have possession (corsi). To make possession more useful, you have to get shots that are in the direction of the net (Fenwick), and preferably, ones that hit the net (uh, shots). It's better to have shots within the home plate area (Scoring chances), and even more preferably, within the slot (HDSCs). The more you generate those, the more likely you will score.
Think of this as a pyramid. Every shot attempt is a corsi event, but not a Fenwick event. As you go upwards, the numbers will get smaller and smaller, but ideally, they get smaller in proportion. All of these stats should correlate, not always, but they should. A team can be good at possession, but have absolutely no ability to get within the home plate area. While rare, there are teams that can rarely hold the puck more than their opponents, but somehow find a way to get chances within the slot.
With that in mind, let's look at today's game.
Corsi chart:
As always, from hockeystats.ca
Well they definitely won the corsi battle!
5v5
Thanks to some penalties….
5v5 score adjusted
… and falling behind by two early on.
Scoring chances (EV)
Here's the thing though. They certainly had the possession, but they didn't make much good use of it. For more info, let's go to the next section.
Shot plots
From war-on-ice.com
Goals are in red. Misses are in black. Blocks are in green. Saves are in blue.
Rush attempts are larger and italicized.
Rebound attempts are larger.
All:
5v5:
As said in the preamble in the beginning, it is not only important to have possession, but have meaningful possession. The Flames didn’t do that. At 5v5, they had two less scoring chances than the Blues, though curiously, two more HD scoring chances. Again, it wasn’t in proportion to the number of shots and shot attempts they were generating. Count how many blasts are from the point, or just outside of the home plate area.
Individual corsi chart:
| CF% All | OZS% All | CF% EV | OZS% EV | |
| Johnny Gaudreau | 81.08 | 76.19 | 74.07 | 64.29 |
| Josh Jooris | 75.00 | 83.33 | 75.00 | 83.33 |
| Mason Raymond | 71.88 | 85.71 | 60.87 | 71.43 |
| Dennis Wideman | 68.18 | 78.95 | 60.00 | 66.67 |
| Mikael Backlund | 65.22 | 77.78 | 65.00 | 71.43 |
| Sean Monahan | 63.64 | 66.67 | 62.07 | 62.50 |
| Joe Colborne | 58.82 | 81.82 | 48.15 | 50.00 |
| Mark Giordano | 58.33 | 63.16 | 55.81 | 56.25 |
| TJ Brodie | 56.52 | 51.94 | 54.76 | 46.67 |
| Dougie Hamilton | 55.88 | 92.31 | 50.00 | 90.00 |
| Kris Russell | 51.22 | 88.24 | 35.48 | 80.00 |
| Jiri Hudler | 50.00 | 80.00 | 38.10 | 71.43 |
| David Jones | 48.15 | 45.45 | 48.15 | 40.00 |
| Micheal Ferland | 46.88 | 66.67 | 37.04 | 50.00 |
| Markus Granlund | 45.83 | 71.43 | 40.91 | 66.67 |
| Deryk Engelland | 40.00 | 33.33 | 40.00 | 33.33 |
| Matt Stajan | 39.29 | 60.00 | 37.04 | 50.00 |
| Sam Bennett | 27.27 | 62.50 | 27.27 | 62.50 |
The good:
The bad:
The ugly:
Up Next:
The Flames are back in action tomorrow against the Red Wings, who they have found success against before.
by xx xx


Battle of the Basement: Flames-Sharks Game Day Preview, Notes, How to Watch

Keeping Things Positive: Flames-Canucks Game Day Preview, Notes, How to Watch

Five Mind-Blowing Stats as Flames Become the Nate Diaz of the NHL

Craig Conroy Takes a Flyer on Trending Finnish Goaltender
