Calgary Flames
Flames vs Ducks – Stats Requack
We lost and now it's time we really assess how we continue playing against the West.
As you’ll see in this brief rundown of last night’s game, the Flames reliance on the 3rd period was their undoing. The unlucky bounces/bad goals really did them in and it’s probably time we accept that the luck is running out despite their play in the final period.
Courtesy of Hockeystats.ca
Flames vs Ducks – All Situations
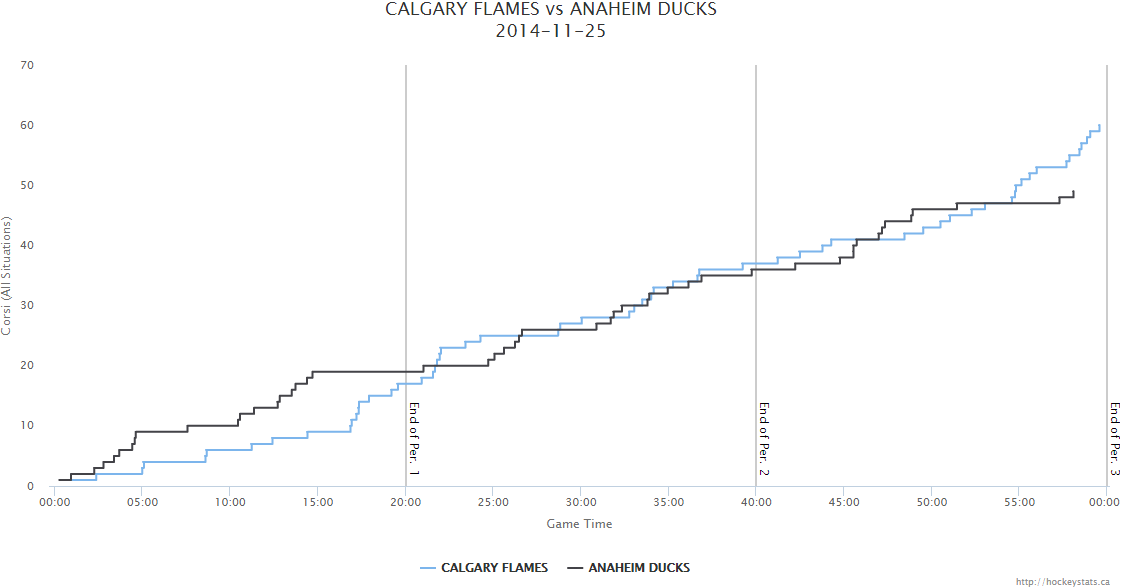
- Another slow start on the evening for Calgary. Even down a goal, no real push to make the situation better possession wise until late into the first period where they increase it 66% in 1 minute span.
- The continued momentum from that late push coupled with the Devante Smith-Pelly penalty helped the Flames take a lead in CF% just over 4 minutes into the second period. Thankfully the Mat Clark penalty helped that but it wouldn’t last.
- The two teams exchanged leads in possession throughout the period until by the end of it, the Flames lead by one Corsi event.
- Trailing 3-0 in the third didn’t do them much good. Even with score effects, they minimally increased Corsi-for in their favour at small periods. It wasn’t until the TJ Brodie goal that they made their biggest strides (also their trademark) and out-chanced the Ducks 13-2 in the final couple minutes of play.
- This is honestly the team we’ve been watching all year, a team although plagued by injuries of some key possession guys.
- They have issues generating attempts at ES even though Mark Giordano, TJ Brodie, Sean Monahan, and a few others contribute immensely. The team’s depth issues are VERY visible here.
- There are three intervals shown in the graph above, two of which happen in the second period that show their ability to sustain small amounts of time doing good things.
- The rest of the time is spotty chances and the over-inflated shooting %
Either way, there are moments like the third period (much like every third period this season) that captivate the fans and have them buy into the team through this season. It's good, it keeps the fans enthralled and supportive yet often clouds their judgment about the success of the team. We should be pleased our team isn't rebuilding like Edmonton or Buffalo; both of which have embarrassed themselves for obvious reasons.
Period by Period data along with Flames ES data courtesy of NaturalStatTrick.
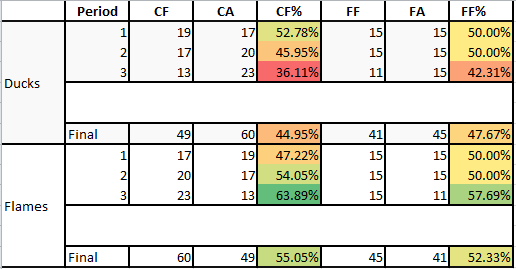
Thanks to the man-advantage time in the second and the push in the third, we managed to improve possession wise in all situations. Yet still, the lingering goal of being positive as much as possible at even strength continues.
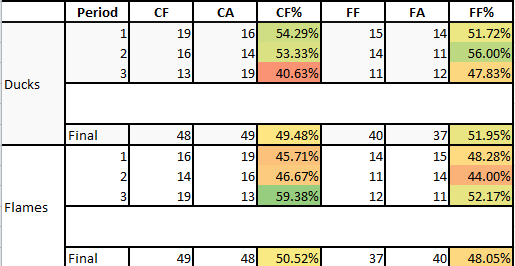
Below is the Flames specific data from 5v5 situations/ES.
Flames – Even Strength
- Sven Baertschi needs more TOI against tougher competition and better linemates.
- Brodie and Giordano continue doing what we know they do regularly. Albeit this time their OZS% does pad that a little bit.
- Contrast that with Sean Monahan getting the third hardest OZS% at even strength this game and coming out above. Optimally we need to find a better option on the RW than Lance Bouma. No knock on Lance but he isn’t a top six guy.
- Curtis Glencross with Monahan is something we’ll accept for now. It’s working and they compliment each other. I’m hopeful they keep them this way until Matt Stajan and Mikael Backlund return.
- Dennis Wideman and Kris Russell both have some rough nights. Russell, fighting Ryan Kesler wasn’t a great idea. They matched up primarily against Hampus Lindholm, Kesler, Kyle Palmieri, Cam Folower, Mat Clark, and Sami Vatanan. All of which slaughtered them.
- Our second line of Granlund, Gaudrau, and Hudler had another rougher evening; especially with their zone starts. It’ll only be a matter of time until they’re more consistent but I really love this line.
- Corban Knight, barely got any ice time as he was glued to Bollig and Sven’s hips. The line did good with their limited ice time. They primarily saw Andrew Cogliano (king of Ironmen), Jakob Silfverberg, and other bottom six guys for Anaheim. They did well.
Period by Period – ES Data organized by HockeyGoalieEh
| Player | Pos. | Period One | Period Two | Period Three | Total | ||||||||||||||||
|---|---|---|---|---|---|---|---|---|---|---|---|---|---|---|---|---|---|---|---|---|---|
| CF | CA | CF% | CFREL% | CF | CA | CF% | CFREL% | CF | CA | CF% | CFREL% | CF | CA | CF% | CFREL% | ||||||
| Brandon Bollig | L | 8 | 4 | 66.67% | 31.88% | 1 | 2 | 33.33% | -14.81% | 1 | 2 | 33.33% | -20.00% | 10 | 8 | 55.56% | 10.94% | ||||
| Corban Knight | C | 6 | 4 | 60.00% | 20.00% | 1 | 2 | 33.33% | -14.81% | 1 | 0 | 100.00% | 52.94% | 8 | 6 | 57.14% | 12.22% | ||||
| Curtis Glencross | L | 1 | 5 | 16.67% | -35.06% | 8 | 5 | 61.54% | 26.24% | 1 | 1 | 50.00% | 0.00% | 10 | 11 | 47.62% | 0.84% | ||||
| Dennis Wideman | D | 4 | 8 | 33.33% | -18.84% | 3 | 5 | 37.50% | -12.50% | 2 | 2 | 50.00% | 0.00% | 9 | 15 | 37.50% | -13.35% | ||||
| Deryk Engelland | D | 9 | 5 | 64.29% | 30.95% | 2 | 6 | 25.00% | -29.55% | 2 | 3 | 40.00% | -13.85% | 13 | 14 | 48.15% | 1.72% | ||||
| Jiri Hudler | C | 4 | 7 | 36.36% | -13.64% | 1 | 3 | 25.00% | -25.00% | 3 | 5 | 37.50% | -22.50% | 8 | 15 | 34.78% | -16.88% | ||||
| Johnny Gaudreau | L | 4 | 6 | 40.00% | -8.00% | 1 | 4 | 20.00% | -32.00% | 3 | 4 | 42.86% | -11.69% | 8 | 14 | 36.36% | -14.46% | ||||
| Josh Jooris | R | 5 | 4 | 55.56% | 13.25% | 4 | 5 | 44.44% | -3.17% | 3 | 7 | 30.00% | -45.00% | 12 | 16 | 42.86% | -6.23% | ||||
| Kris Russell | D | 3 | 11 | 21.43% | -40.48% | 3 | 5 | 37.50% | -12.50% | 3 | 2 | 60.00% | 13.85% | 9 | 18 | 33.33% | -20.24% | ||||
| Ladislav Smid | D | 9 | 3 | 75.00% | 44.57% | 3 | 6 | 33.33% | -19.05% | 2 | 3 | 40.00% | -13.85% | 14 | 12 | 53.85% | 9.99% | ||||
| Lance Bouma | L | 1 | 5 | 16.67% | -35.06% | 8 | 5 | 61.54% | 26.24% | 1 | 2 | 33.33% | -20.00% | 10 | 12 | 45.45% | -2.09% | ||||
| Mark Giordano | D | 3 | 4 | 42.86% | -3.57% | 8 | 5 | 61.54% | 26.24% | 4 | 4 | 50.00% | 0.00% | 15 | 13 | 53.57% | 9.94% | ||||
| Markus Granlund | C | 4 | 6 | 40.00% | -8.00% | 1 | 4 | 20.00% | -32.00% | 5 | 0 | 100.00% | 69.23% | 10 | 10 | 50.00% | 3.97% | ||||
| Michael Ferland | L | 3 | 4 | 42.86% | -3.57% | 4 | 7 | 36.36% | -16.27% | 1 | 2 | 33.33% | -20.00% | 8 | 13 | 38.10% | -11.90% | ||||
| Paul Byron | C | 3 | 4 | 42.86% | -3.57% | 4 | 5 | 44.44% | -3.17% | 1 | 1 | 50.00% | 0.00% | 8 | 10 | 44.44% | -3.25% | ||||
| Sean Monahan | C | 1 | 5 | 16.67% | -35.06% | 8 | 5 | 61.54% | 26.24% | 2 | 2 | 50.00% | 0.00% | 11 | 12 | 47.83% | 1.16% | ||||
| Sven Baertschi | L | 8 | 3 | 72.73% | 39.39% | 1 | 1 | 50.00% | 3.57% | 5 | 1 | 83.33% | 50.00% | 14 | 5 | 73.68% | 34.62% | ||||
| T.J. Brodie | D | 4 | 7 | 36.36% | -13.64% | 9 | 5 | 64.29% | 33.04% | 5 | 4 | 55.56% | 11.11% | 18 | 16 | 52.94% | 10.08% | ||||
| Team | 16 | 19 | 45.71% | 14 | 16 | 46.67% | 9 | 9 | 50.00% | 39 | 44 | 46.99% | |||||||||
| Player Data from War-On-Ice.com | |||||||||||||||||||||
Use the data above as you want, it provides value for quick reference through the periods of play. Though this doesn't factor in zone starts, fenwick, score close, etc. Just raw Corsi data from each period.
Overall, it was a game of clarity last night as we lost being unable to rely on the third period pushes we’ve made a name with. Tonight we take on the San Jose Sharks and hopefully we can rebound with a stronger game for more than 1 1/2 periods of play.
by Mike Pfeil


Battle of the Basement: Flames-Sharks Game Day Preview, Notes, How to Watch

Keeping Things Positive: Flames-Canucks Game Day Preview, Notes, How to Watch

Five Mind-Blowing Stats as Flames Become the Nate Diaz of the NHL

Craig Conroy Takes a Flyer on Trending Finnish Goaltender
