Calgary Flames
Flames Scoring Chances Through 10, a Follow-up
As noted below, Scott was good enough to gather together my scoring chance counts from games 1-10. Some notes before interpretation:
– My definition for a scoring chance was: a puck directed at the net from a certain portion of the ice in the offensive zone. The area I determined to be prime chance real estate was a triangle or pie shape, extended from the goal up to about the top of the face-off circles. Shots from the boards and point shots were therefore excluded. Also excluded were shots blocked close to the source, meaning, a shot wasn't counted as an opportunity if it had no real chance to get by the shin pads in front of it. Also excluded were "chances at chances", such as a pass through the slot which is missed by the recipient or, say, a botched two-on-one where the puck is intercepted by the defender or the shot fanned on.
– Obviously this method doesn't "rate" scoring chances themselves. A break-away is obviously a better quality chance, than, say, a shot from the slot through a bunch of traffic and defenders. However, I discovered the amount of really high quality chances is actually pretty small in every contest, so it's not a big issue.
– I tried to be as true to this criteria as possible, but there was still an element of subjective judgment involved. For example, you'd be surprised how many shots originate just outside the range defined here (top of the face-off circles or slightly outside the face-off dot). Also, deflections can be very challenging to define as chances, since they are so random and unpredictable. Sometimes it's unclear whether the puck hit a defender or an attacker and/or if the deflection was in any way purposeful. As such, I was pretty ruthless about counting deflections, often cheating to the "not" side of things. Of course, I also tried to count everything the same for either team and no matter who was on the ice.
Scott was good enough to post the totals below, but I thought the ES differentials would be nice to have as well. Here they are, in ranked order.
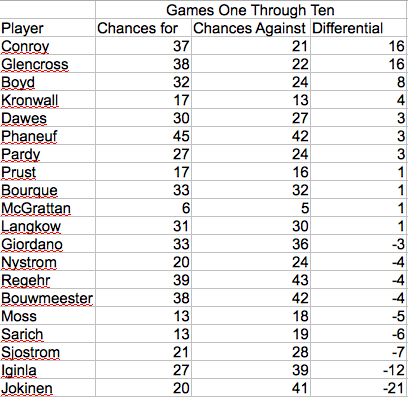
Keep in mind, this is just a 10 games sample (a mere one eighth of the season) so all the caveats that come with small samples apply here. For example, Boyd, Glencross and Conroy were a unit to start the year and they had a couple of games where they knocked it out of the park by this metric, which is why they are way out in front of the pack. I would expect that difference to settle out over time because, as much as I like each guy, I doubt that trend will hold all season.
It shouldn't be any surprise to anyone that Iginla and Jokinen are pulling up the rear though. They were, without hyperbole, horrendous in October which was exacerbated by Sutter beginning the season by going power vs. power. However, the fact that Jarome was playing some of his worst hockey in recent memory, faced tough circumstances and was still well clear of Olli (who spent some time on the third line during this period I believe) gives us an indication of who the weak link was.
I would have liked to apply some sort of standardization to correct for ice-time, but, short of combing through the first 10 game sheets and adding up each players ice-time (which I don’t think I have the patience for), there isn’t any way to look up each guys ice time through the first 10 games only. The reason this would be interesting is it would give us an idea of how many chances a guy is generating, say, per 60 minutes of ice. Eric Nystrom and Olli Jokinen were on for the same number of scoring chances through 10 (20 each), but one guy tends to play a lot more than the other. A rate per hour would give us a better idea of what each guy is doing above and beyond the raw totals. Something to keep in mind for the next round, I guess.
by Kent Wilson


Battle of the Basement: Flames-Sharks Game Day Preview, Notes, How to Watch

Keeping Things Positive: Flames-Canucks Game Day Preview, Notes, How to Watch

Five Mind-Blowing Stats as Flames Become the Nate Diaz of the NHL

Craig Conroy Takes a Flyer on Trending Finnish Goaltender

Flames Daily: Player Grades, Flyers Fans Experience Schadenfreude
Craig Conroy Takes a Flyer on Trending Finnish Goaltender
Five Mind-Blowing Stats as Flames Become the Nate Diaz of the NHL

Player Grades: Flames Counterpunch Their Way Past Coyotes
Flames Daily: Player Grades, Flyers Fans Experience Schadenfreude